Andrea Unger’s DAX breakout strategy was so simple I couldn’t resist trying it out myself.
Now, there are many approaches I could have taken to work out if this strategy was right for me and if, indeed, it worked at all.
If you’ve been following my podcast, you’ll know I’ve been diving deep into trade automation – so that’s exactly where I started.
Trade automation meant I was able to quickly turn his entire strategy into software that would put me in the driving seat when it came to testing and optimizing it to suit my risk appetite.
First, let’s breakdown the strategy
Andrea strategy is best described by him. So, here’s the quote from the podcast episode where he revealed the full strategy:
 “Well, considering what I said I suggest to evaluate the first hour breakout! This is an “old” approach to buy or sell the breakout of the range of the first hour.
In today’s markets it’s not easy to find where it still works but I built a strategy on the DAX future which is still producing results. The setup is valid all days except Fridays and enters levels calculated from high or low of the first hour range bar with a displacement of 75% of the range itself. An additional filter is not to trade if the body of daily range of yesterday was larger than 75% of the total range.
Exit is at the end of the day or, if prices retrace, at high (for longs) or low (for shorts) of the first hour.”
When you break it down, the whole think looks like this:

Back Testing at the “Speed of Byte”
With Andrea being an Algo Trader, it was great to get a well defined strategy with mechanical rules that were not left for interpretation.
So, taking his rules I was able to automate the strategy in no time at all.
One decision I made that I normally don’t, was to use the historical data from my Broker instead of my normal testing platform. Their data was pretty good and a nice match to their live data so I knew it I would be happier trading it live if I could find something that worked.
Testing the original strategy…
From March 2013 to March 2016 it was profitable and had a nice upwards curve with a few down periods, but I wanted to test it using recent market data as the markets tend to change every 18 months or so. So, I decided to optimize the strategy using data from the past year only: March 2015 – March 2016…. And here’s the result:
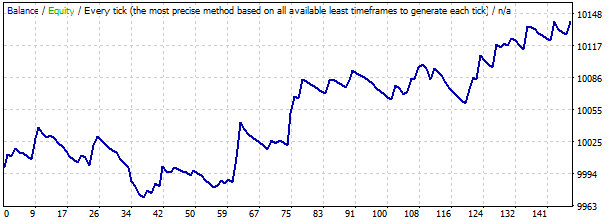
Total return: $140.38
After running this test I thought, “Yes! I have the beginnings of something profitable… Next step… make it even better!!”
Oh, and if you’d like to learn how to automate strategies (without touching any code), like I’ve done with Andrea’s, simply subscribe below:
[optin-cat id=1291]
Now, below you’ll find the exact steps I took to turn this strategy into something I would be confident trading.
And at the end I reveal the full strategy I’m planning to trade on my live account.
Let’s get into it!
Step 1. How to Make a Good Strategy Great
This is where the fun begins.
We have a solid strategy provided by a 4 Time World Trading Competition Winner, and our first back test over a few years has shown promising results. So, it’s time to get to work and see how far we can take this strategy.
I approach this with three things in mind:
- Will I be able to trade this strategy from an emotional standpoint?
- Can I handle how often it loses?
- Can I handle how often it trades?
- Can I let the winners run?
- Can I risk enough to make it worth my while?
- Am I confident the strategy is robust?
The above point will mean I can trade the strategy live and be happy with my level of risk. It will also mean I’ll be less likely to interfere with the strategy and handle losing days or weeks if I have to.
- Are the changes I’m making to the strategy, changing it to fit an upwards curve?
- Am I changing the rules to avoid 1 or 2 big losses?
- Am I changing the rules to catch 1 or 2 big trades?
The above point will mean that the final strategy won’t self-destruct in the future due to anomalies that are bound to occur.
- Am I happy with the metrics?
- The number of consecutive losses
- The profit percentage
- The average winning trade size
- The maximum draw down
The above point will help me determine if it’s a strategy is worthwhile trading and robust enough to accommodate any issues, e.g. if I miss one day out of a month due to a technical issue or some other problem.
Step 2. Get Creative with Profit Opportunities
To help me come up with opportunities or ideas to squeeze more profit from this strategy (or any strategy for that matter) I head back to the charts first to see if I can find obvious patterns that happen enough to warrant further testing or investigation.
For this strategy I thought the following had promise:
Idea 1)
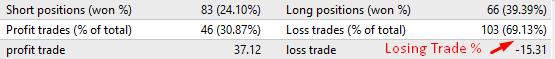
The losing trade % was quite high, so what if I could offset the losers?
Idea 2)
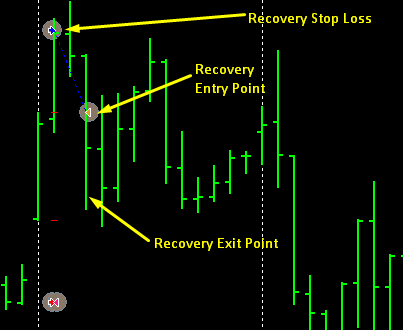
The price often went further in the same direction when a loser was hit, so what if I entered a trade in the opposite direction as soon as the stop loss was hit, and made that trade the same size as the losing trade?
Idea 3)

If the first trade was a loser, sometimes the price would have a good trend in the opposite direction, so instead of deleting the pending order that wasn’t triggered, what if I let it trigger that order as well?
Idea 4)

What if I adjusted the length of time the Pending Order was open for, so for example, deleting the Pending Order after the 2nd bar or the 12th bar. Would that prevent losers being hit and still catch most of the winners?
I had a few more ideas that I tried out and I will probably take a fresh look again in the future… sometimes a break to let the dust settle can be a good thing.
Step 3. Optimize. Optimize. Optimize.
As with all strategies, they can be broken down into smaller parts that you can look at individually in an attempt to improve results.
Below are the core components to any strategy and the insights I found that will help me pick my final strategy.
1. Can I improve the Entry?
For this strategy I tried optimizing the entry point based on the day of the week as a starting point. Here you can clearly see that some days are better than others. So, it’s a case of picking the days you want to leave out versus the ones to include. Below it’s pretty clear that Monday should be left out. What’s unknown is if I remove the Prior Day Filter (as per Andrea’s suggestion) will I affect these results… So we’ll need to test that too!
Here are the results from my daily testing:
Monday Profit $-4.69:
Tuesday $74.38:

Wednesday $19.40:
Thursday $29.07:

Friday $22.22:
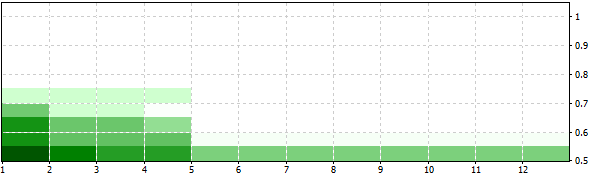
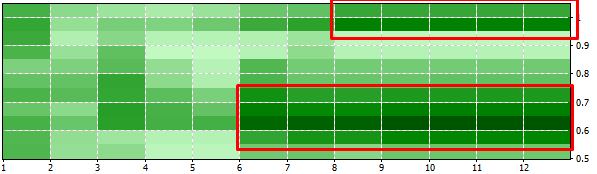
Next up is the distance of the entry offset taken from the first candle.
Currently it’s set at 75%, but would another figure work better? Here are the results I received whilst running an optimization test:

I found that 65% actually produced the best results for profitability and the region around it also produced high results, so I could be quite confident that numbers round this region would be robust. Here’s the chart:
Total Return: $157.71 (up 11% on our original test)
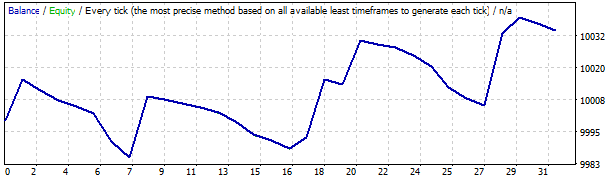
I had a hunch the expiry time of the Pending Orders may also be a key factor, so optimized for Order Expiry time. Sticking with the 65% range, will we better the results?

A dramatic improvement in the overall return but there is a more prominent negative return period that I would have to cope with emotionally.
Here are the results using an 8 hour expiry for our pending orders:

Total Return: $169.03 (up 17% on our original test)
So, here are the metrics that worked from an Entry point of view (albeit independently):
– Offset by 65% of the 1st hours range
– Expire the Pending Orders after 8 hours
– Best trading days Tuesday, Wednesday, Thursday and Friday
I know, it’s a bit different from Andrea’s results but mine are skewed to what’s happening in the market now versus what worked 5 years ago.
Step 2. Can I improve the Exit?
Trade exit can make or break a strategy, so trying multiple exit strategies that make sense can sometime yield better results. That said, I’ve found that the simplest strategies are often the best.
Here’s what I tried based on my profit opportunity ideas:
Based on Idea 3 above – leave both pending orders active until they are triggered or not. This way I’ll either get a trend in one direction, two stop outs or catch the trend after the original stop out, or only have the original stop out and no trend on the opposite side…. Confusing eh! Here’s where we ended up:
With 8 hours and 65% as the settings this end result of $129.23 didn’t improve the benchmark.
I tried idea’s 1, 2 and 4 out as well – all with no success. As I said earlier. The simple exits usually work the best.
Step 3. Can I improve any Filters?
I added Andrea’s Prior Day filter to see if that made a positive or negative change.

Well, we were actually worse off with a result of $138.59. So, with this filter we may be filtering out good profit opportunities.
Step 4. Can I put everything together to make it work for me?
First, what do we know now?
- We have a vague idea which weekday’s work best using the original settings but don’t know how they work with other settings and if the optimized settings are better on certain weekdays than others.
- We know the filter may give up profit opportunities and doesn’t really help give us a nicer equity curve
- We may suffer periods of several losing trades with pending orders lasting 8-12 hours
- We have some good ranges for when to cancel the pending order and the offset of our pending order from the first bar high and low – 50-75%
Secondly, what don’t we know?
- We don’t know how all the above work together – days, hours, offsets. How do all the combinations of these perform in unison?
To answers this question we need to run a test across multiple combinations.
So, to lock in my final strategy I’m going to run an optimization test for each weekday and for the hour periods 1-12 and offset between 50-100%, then pick the weekdays that will fit me emotionally, not necessarily by the amount of profit I can yield.
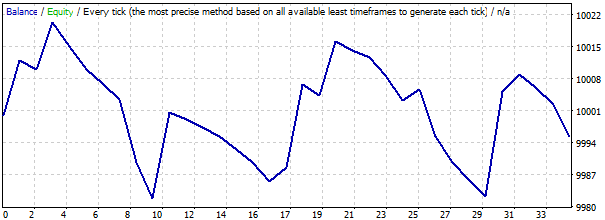
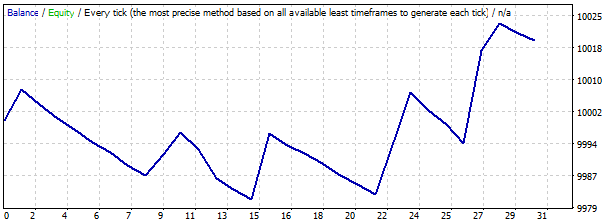
Here are the results for Monday:
Not much in the way of successful strategies with 72% unprofitable. There could be a case here for not including Monday’s in the final strategy.
Total Monday Return $33.85 (up 100%+ from our original test)
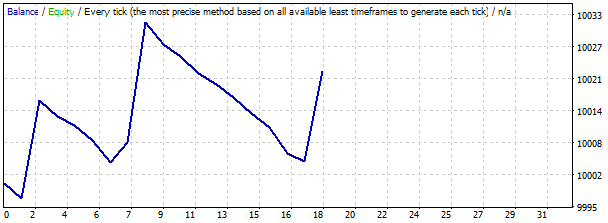
Here are the results for Tuesday:

The chart above shows the best area is round the 1 hour pending order cancellation period and the 50% – 80% mark. With the best being at 55%.
Running the best Tuesday with settings of 55% offset, 1 hour pending order expiration and the filter turned on produced this:

Total Tuesday Return $108.60 (up 31% from our original test)
Here are the results for Wednesday:
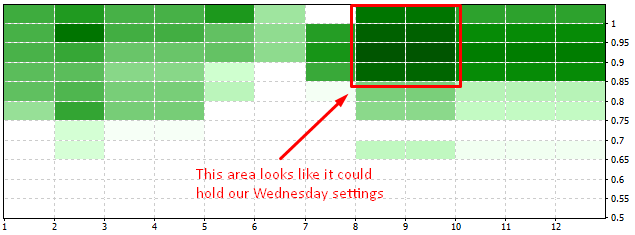
The interesting settings look to be around the 8-9 hour mark and the 85%-100% mark. When you look at the best result below (9 hours & 90%) you see that there isn’t a steady curve which could be a consideration for leaving Wednesday out.
Total Wednesday Return $46.82 (up 59% from our original test)
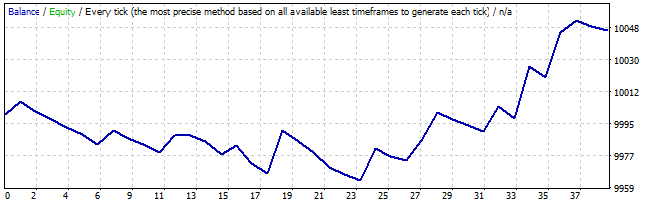
Here are the results for Thursday:

A number of combinations work on a Thursday, so overall it’s a good day compared to, say, Wednesday. Running the best settings 7 hours and 70% produced the following:
 Total Thursday Return $100.52 (up 71% from our original test)
Here are the results for Friday:
Overall positive, but began to break even after a while. Something to consider when going live.
Total Friday Return $54.82 (up 59% from our original test)
Step 4. Decisions. Decisions. Decisions.
To put this whole thing together we need to make a couple of key decisions:
- Do we expect each week day to act in it’s own way? Or does that fall into the realms of “curve fitting”?
- Should we find a middle point for settings that accommodate the whole week?
My gut feel is that each day acts differently, due to news alerts, volatility I’ve seen in each day, and the natural ebb and flow of the week (Monday start and Friday finish). So, individual settings per day it is.
- What days of the week do we want to trade?
Smooth upward curves would have us just trading Tuesday and Thursday, but we’d give up potential profit from Monday, Wednesday and Friday. Other things to consider are how profitable each day is. We can see from the Monday and Wednesday green graphs that they have plenty of gaps (about 50% for Wednesday and 72% for Monday), so if there were any days I wouldn’t trade if would be those two. So, let’s go with Tuesday, Thursday and Friday.
When I’ve built this I can then see how it reacts with the Prior Day filter by toggling it on or off… And then we’ll have our final strategy!
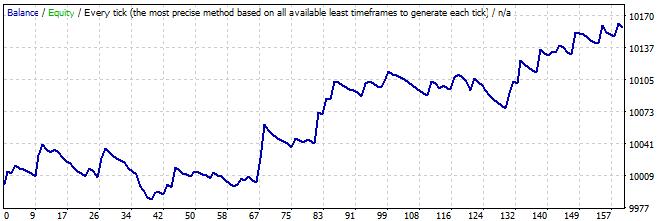
With Prior Day Filter:

Total Return $271.47 (48% up from the original)
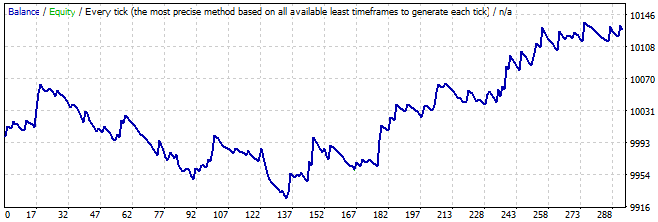
Without Prior Day Filter:

Total Return $231.77
Voilà! I Have My Strategy
It was a fun journey to land this strategy and the end result is one I feel:
- Ultra-confident trading live
- Happy applying larger position sizes
- Will last for a long time to come
Here are the final changes I’ve decided to make to Andrea’s original strategy:
1) Only trade Tuesday, Thursday and Friday using their best settings based on optimization
- Tuesday: 1 hour expiry, 55% first candle size
- Thursday: 7 hour expiry, 70% first candle size
- Friday: 10 hour expiry, 60% first candle size
2) Keep the prior day filter, however, this could be optimized further in the future to see what the optimal body % is.
So, when all was said and done, he had a pretty solid strategy, but now I have the confidence to trade with it live and a better understanding of the expected returns and level of capital I’d be willing to put at risk.
2 Things Before You Go
To see how all this work turns out in my live trading, make sure you subscribe to the 52 Traders podcast, and for more immediate gratification…
If you’d like to join me on this journey of trade automation and learn exactly how to turn your strategies into software you can subscribe to my 5 Day Complimentary “Automate My Trading” Mini Course below:
[optin-cat id=1293]

Taking data for one year only and dividing it into separate days of the week seems like an overoptimization to me. Having a maximum of ~30 Mondays, Tuesdays etc. there is a great chance that the results will be completely different during the next year as the curve for each day is well affected by 2-3 good trades in your example. During the next year, those 20-30 good trades may take place mainly on Mondays and Wednesdays (as this really is pretty random, taking into account more data).
I also optimized the strategy SLIGHTLY but I’m sure it stays in line with the original assumptions, which gives me confidence in the whole system (as it worked within the past dozen of years, right?).
As He Shuhan said: “Think of it this way, look at a period of 10 years series data. Look at 10 years data on, let’s say, the EUR dollar. Or any instrument, S&P, the Dow, or any instrument you want to choose. 10 years data minimally”.
Thanks Kamil,
It’s always good to get someone else’s perspective and insight.
I was conscious I may have been stepping over the line and “curve fitting” even though I state this as one of my things to avoid. Which goes back to the whole emotional aspect and whether I was curve fitting to control my emotions??
I may have to rethink what I go live with and update accordingly.
BTW, He Shuhan also mentioned to me that Market Structure changes every 18 months which I took to mean that optimizing over a more recent time period may be beneficial, as long as you keep doing it.
It might be worthwhile getting him to have a look at what I’ve done and provide comment… will see what I can do there.
Thanks again for keeping me honest… much appreciated!
Yeah, that was just my opinion, I didn’t actually mean to be so critical in my previous post. I really appreciate your work though and I learnt A LOT thanks to all the interviews on your blog. Keep it up! 🙂
All feedback is welcome Kamil.
BTW, the next trader is a gem… will be released shortly.
Cam,
Just stumbled across your site, awesome stuff bro!!
I’ve been listening to the Chat with Traders PODcast for some time, but had not yet discovered yours.
This DAX breakout is a interesting study and even more interesting are the steps you go through to set up the ideas and backtest.
I have two simple setups I trade every day on the ES, one of which is a 30 minute OR (opening range) breakout. Yes, even that age-old simple concept still produces a ton of opportunities, almost every day.
The thing with the ES though is everything it gives you, it typically will also take away…usually in the same day. So you have to day trade it and it’s best to scalp it for like 1-4 points, then get the hell out of it’s way.
It’s price action is pretty pure but it requires a ton of brain power and ability to read what the chart is telling you right now in the context of what has happened in the recent past.
Anyway – awesome site. Love it.
Thanks for the feedback Rob, much appreciated!
Also, I automate a few of the strategies on this site and my other site http://automatemytrading.com… so if your strategy is mechanical enough then feel free to send it through and I can build it up as part of my webinar series.
All the best.
Cam